
Capture PCAPs without Wireshark
 Oliver Ripka
This guide walks you through every step of capturing network packets on Windows, Linux, and macOS, without installing Wireshark.
Why Capture Packets Without Wireshark?
Traditionally, Wireshark has been the go-to tool for network analysis. However, not every situation requires installing heavy software just to capture and review packets. Here are some advantages of capturing packets without installing Wireshark or the npcap driver:
- Improved System Stability: Avoiding the installation of additional drivers (like npcap) helps prevent potential conflicts. Without these drivers running in the background, your system can experience greater stability.
- Easier and Faster Setup: Since there’s no need for extra installations or administrative approvals, setting up packet capture becomes simpler and more efficient. This is particularly useful when you need a quick solution for capturing network data.
In this guide, we’ll explore methods and tools that allow you to capture packets effectively while enjoying these benefits. Whether you’re working on Windows, Linux, or macOS, you’ll learn how to get started without the additional overhead that comes with traditional packet capture tools.
Capturing Packets on Windows
Windows users can capture network traffic using the built-in pktmon command. Follow these simple steps:
- Launch an Elevated Command Prompt:
Right-click on Command Prompt and select Run as Administrator.
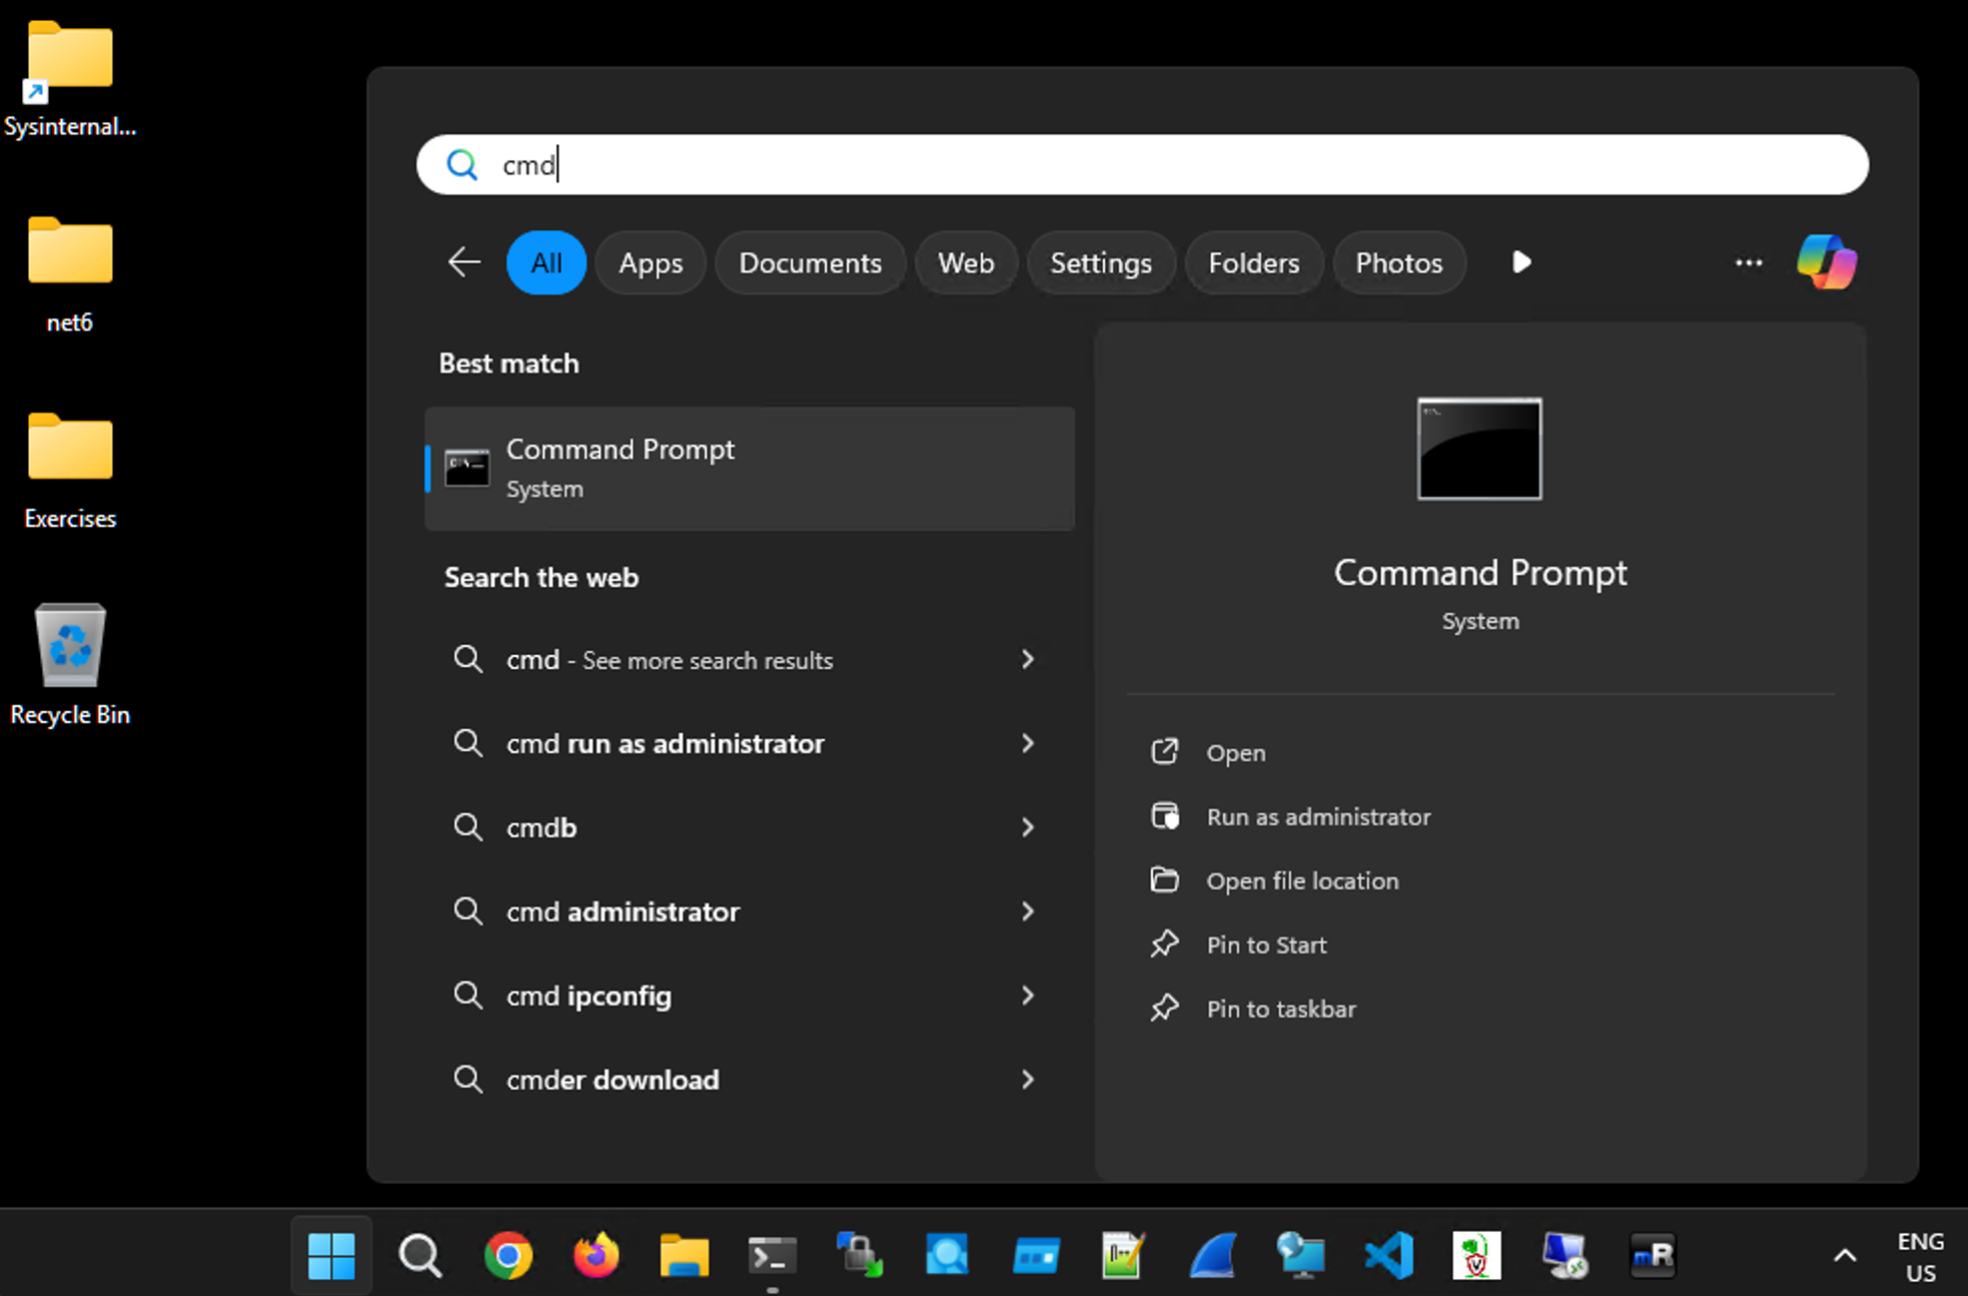
Confirm the UAC prompt: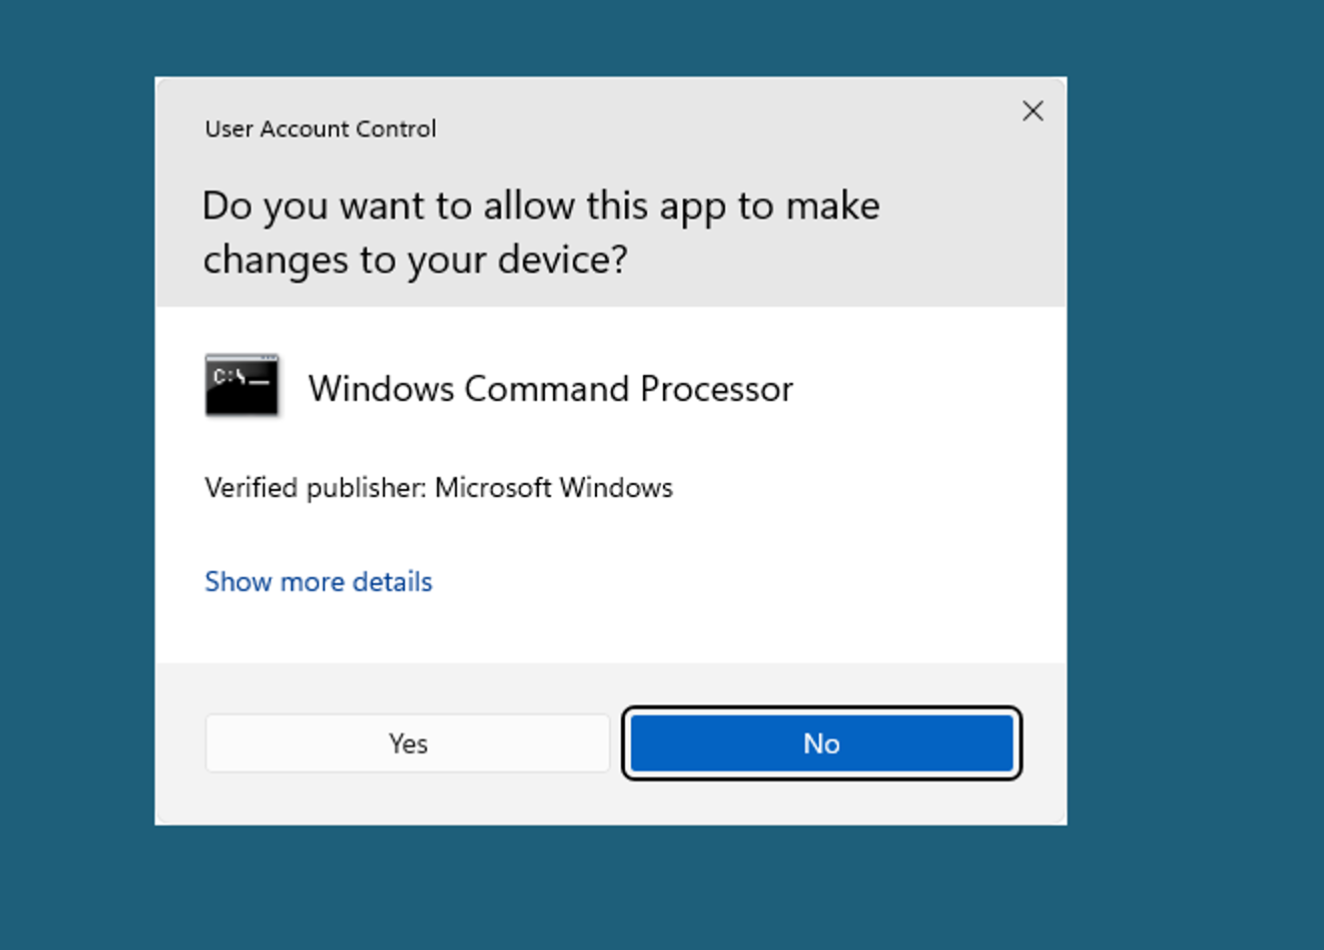
- Start the Packet Capture:
Change directory to the current user's desktop with the command below. This makes it easier to locate your PCAP later.
cd /Users/%username%/Desktop
Then, enter the following command. This lists the available interfaces.pktmon comp list
And start the packet capture on the correct network interface.
- Stop the Packet Capture:
When you’re ready to stop capturing, open an elevated command prompt again and run the following command. Wait a moment until it collects all information.
pktmon stop
After stopping, you will have the file tracefile.etl.
netsh trace start capture=yes report=yes tracefile=.\tracefile.etl persistent=yes maxsize=250 that we previously mentioned in the article. However, when capturing with netsh, it seems that pktmon cannot convert the ETL to PCAP. Only the external tool etl2pcap works.- Convert ETL to PCAPNG:
Using pktmon you can convert the etl to PCAP

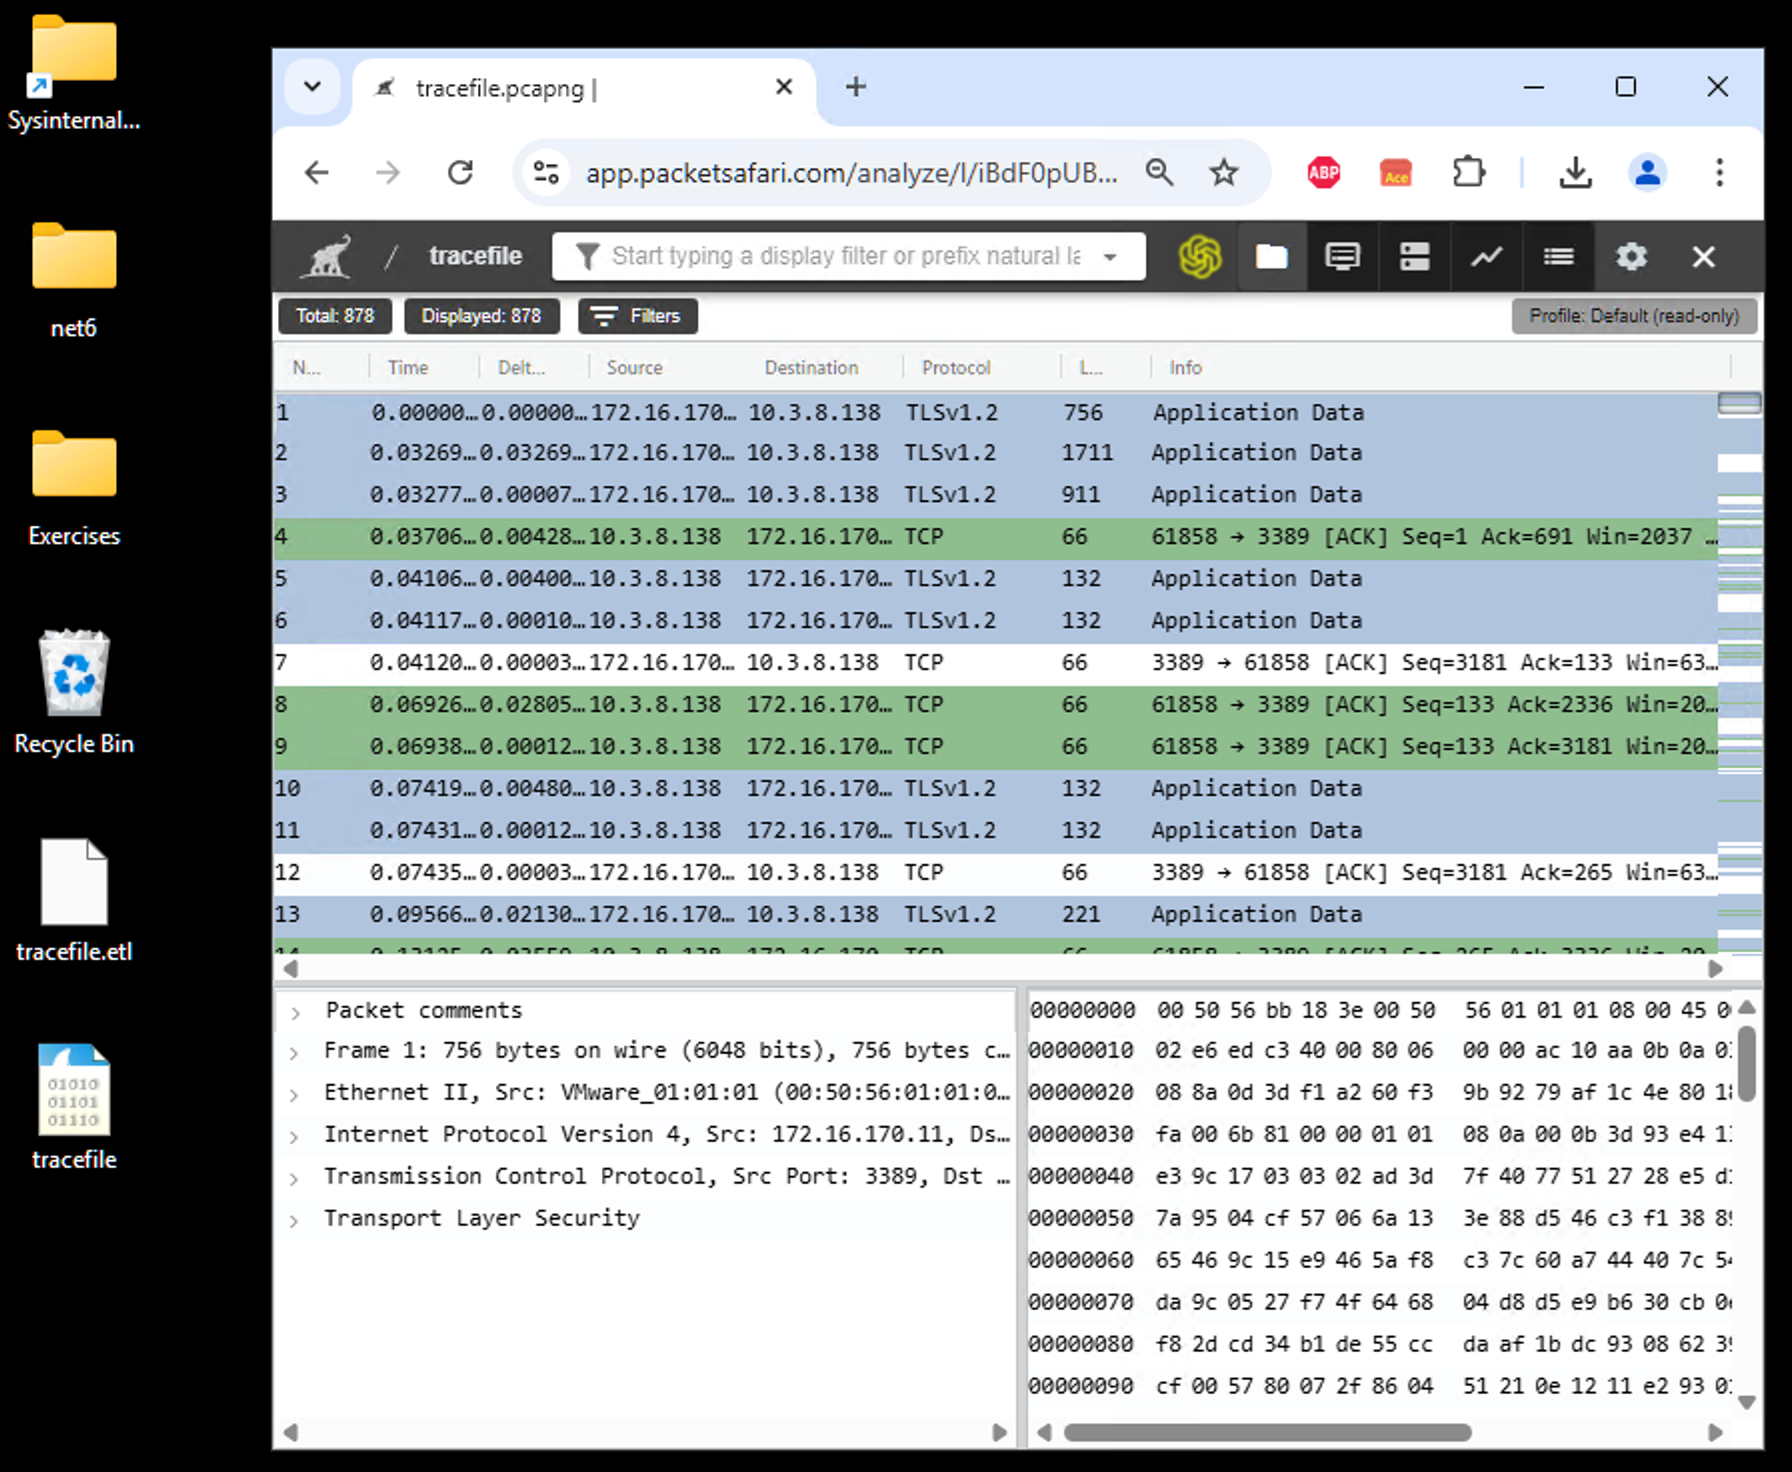
- Analyze with Packetsafari Analyzer:
Once you have your PCAP or PCAPNG file, simply upload it to Packetsafari Analyzer and let our Copilot AI guide you through the analysis.
Capturing Packets on Linux
Linux users have the advantage of using pre-installed utilities like tcpdump to capture network traffic.
- Open a Terminal:
Start your favorite terminal application. List the available interfaces using:
tcpdump --list-interfaces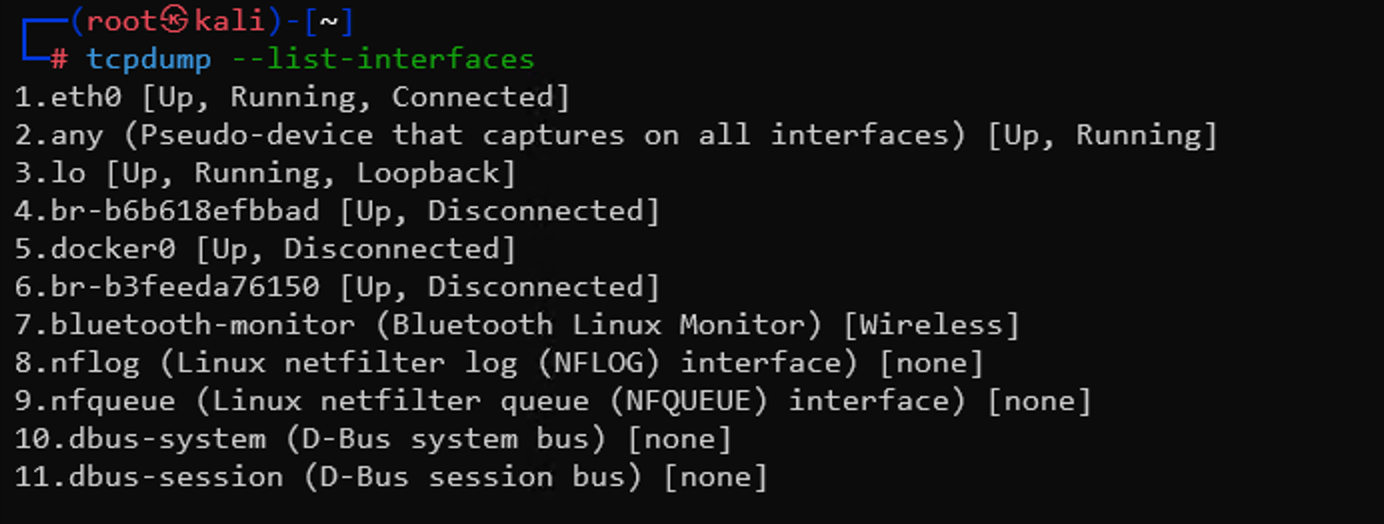
- Capture Network Traffic:
Capture on the active interface using tcpdump. For example:
sudo tcpdump -i eth0 -w capture.pcapng
This command captures all network packets. The-iflag specifies the interface, and the-wflag specifies the output file. Make sure to run it as root or use sudo.
Optionally, you can capture with packet slicing activated. This does not capture all data but only the first 128 bytes, which is useful if you want to upload it to Packetsafari Analyzer later. This approach enhances privacy by avoiding data leakage, but note that slicing means you have less visibility into the data. Only use it if you are sure all necessary information is included.tcpdump -i en8 -w capture.pcapng -s 128
- Stop the Capture: Press Ctrl+C in the terminal to stop capturing once you have collected sufficient data.
- Upload from the Command Line using curl:
You can upload the file to Packetsafari using a simple curl command. You can use the ID to find your PCAP online at
https://app.packetsafari.com/analyze/l/{YOURID}, or use the following command which constructs an ID automatically.curl -X POST 'https://app.packetsafari.com/api/v2/uploadanon/pcap' -F 'file=@capture.pcapng;type=application/octet-stream'
To get a direct link after upload, use:id=$(curl -s -X POST 'https://app.packetsafari.com/api/v2/uploadanon/pcap' -F 'file=@capture.pcapng;type=application/octet-stream' | sed -n 's/.*"id": *"\([^"]*\)".*/\1/p'); echo "https://app.packetsafari.com/analyze/l/$id"
Analyze the file in Packetsafari PCAP Analyzer: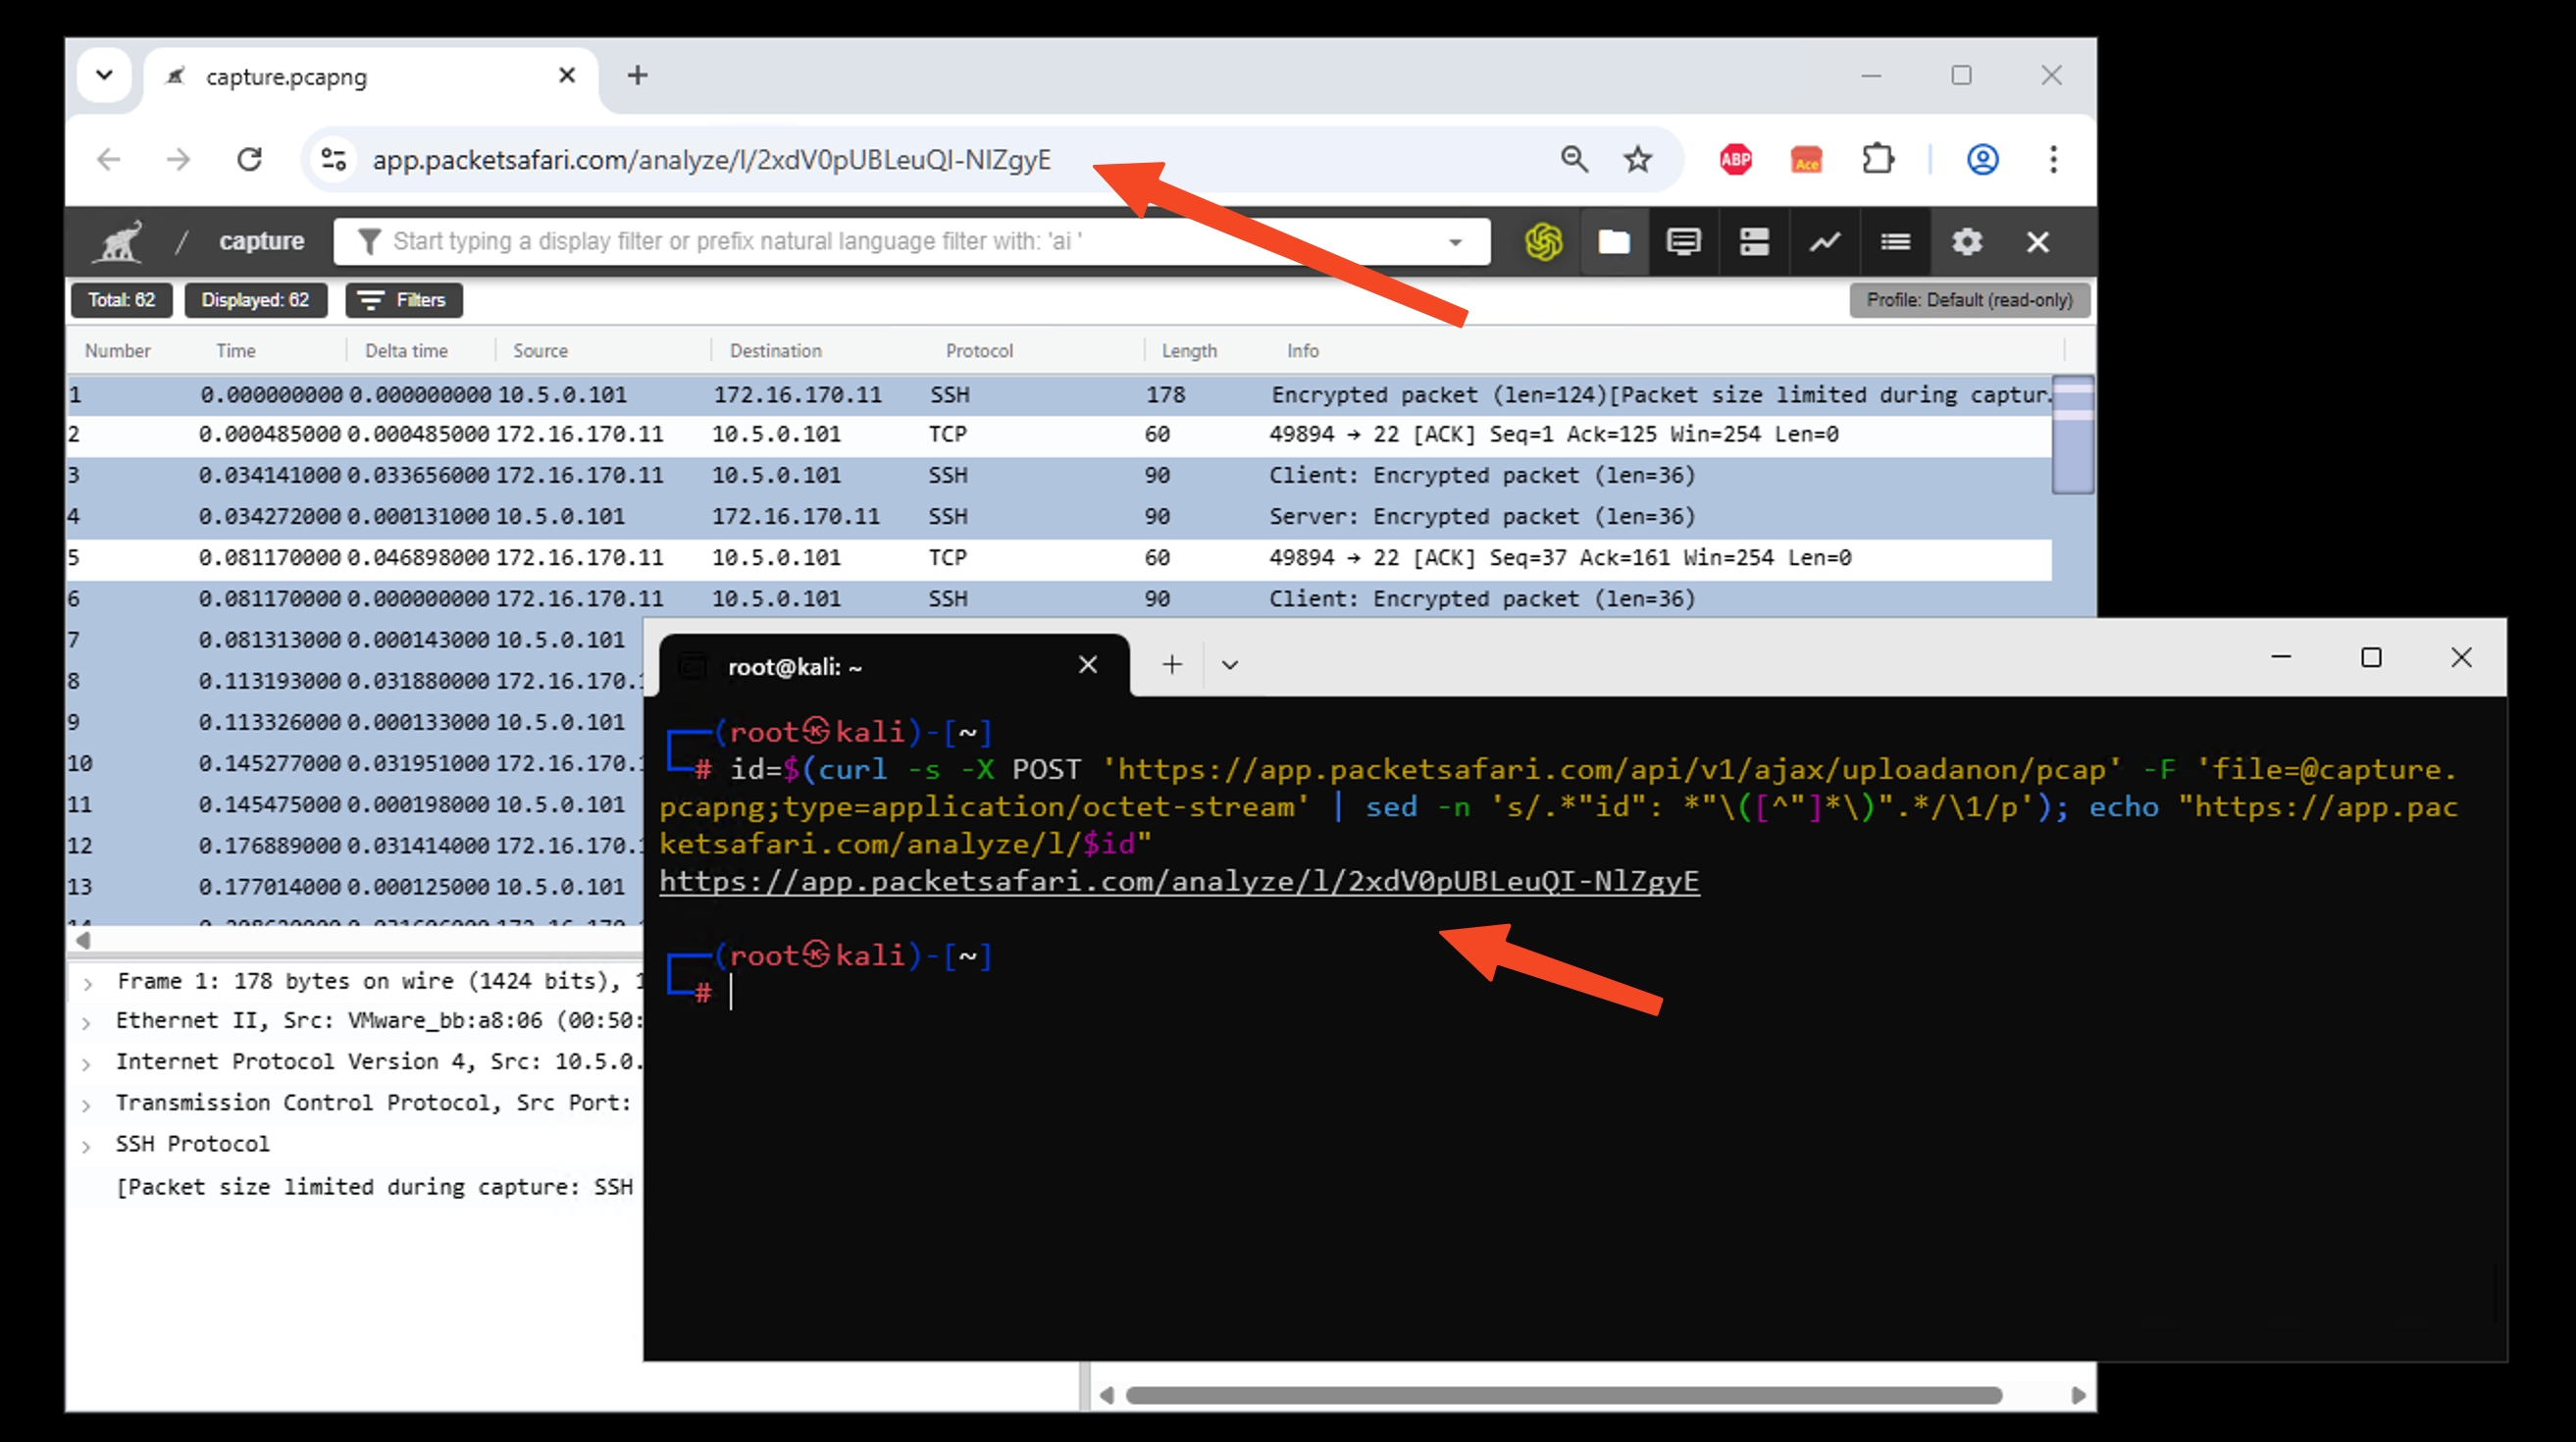
Capturing Packets on macOS
macOS users can also use tcpdump, which is built into the system.
- Open Terminal using Spotlight:
Press Command + Space, type "Terminal", and hit Enter.

Open Terminal and press Enter: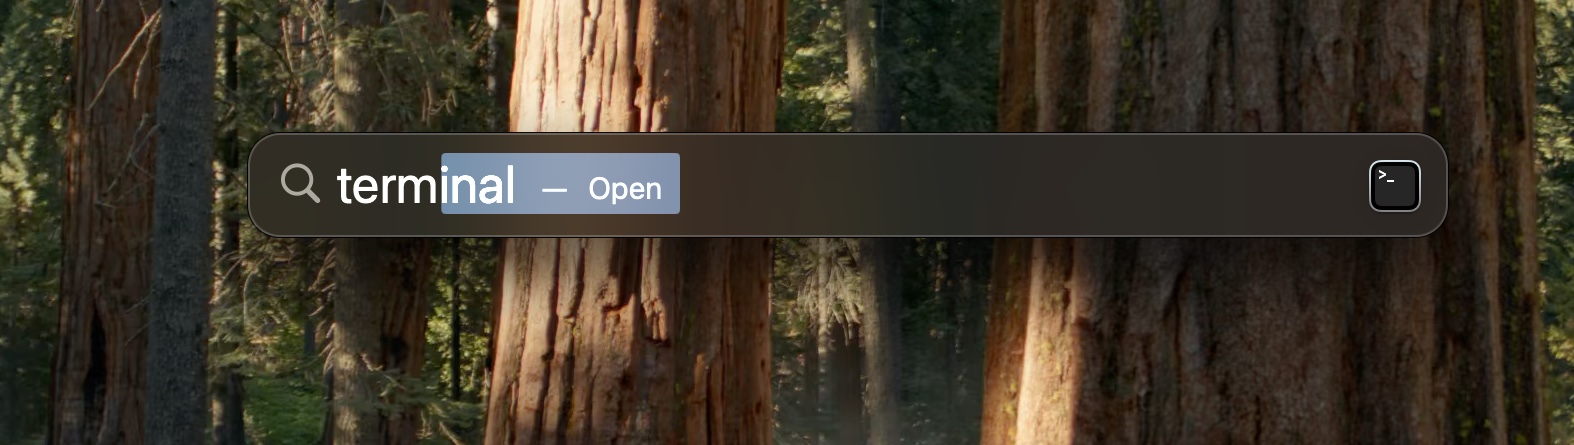
List the available interfaces using:tcpdump --list-interfaces
Look for a connected interface. For example, en0 is my Wi-Fi interface, which is currently not connected, while en8 is a USB-to-Ethernet adapter.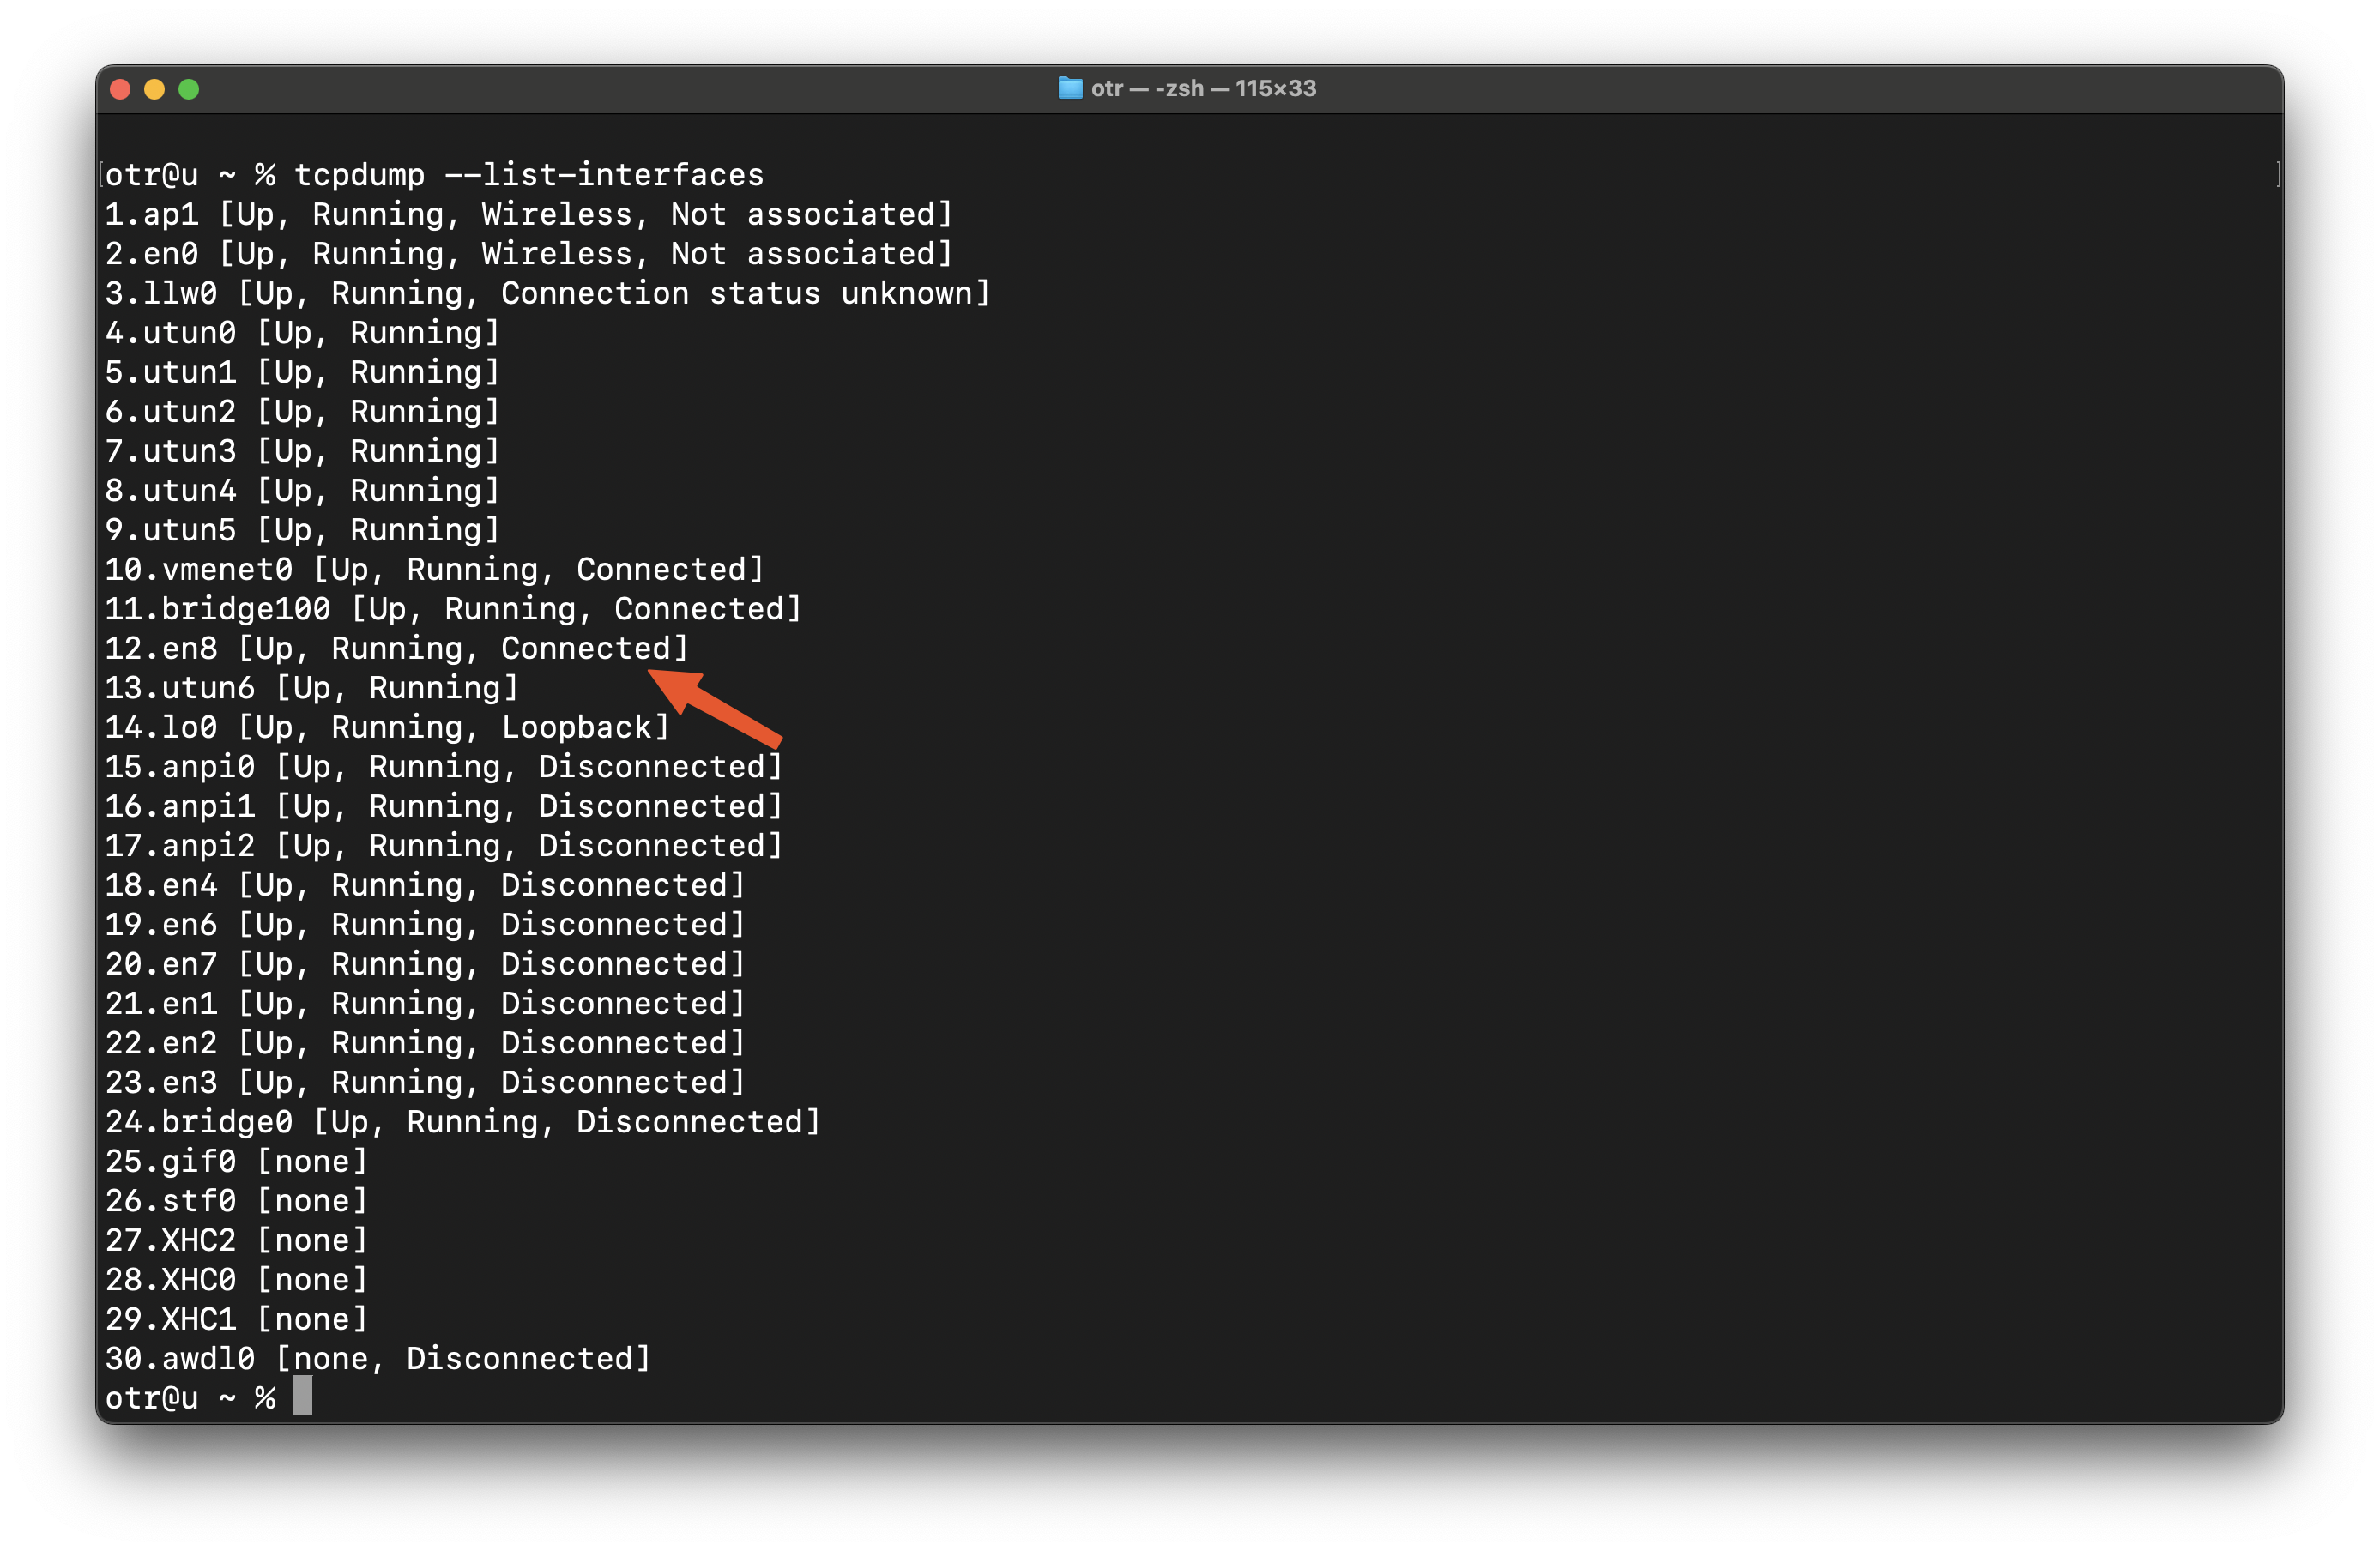
- Capture Network Traffic:
Capture on the active interface using tcpdump:
tcpdump -i en8 -w capture.pcapng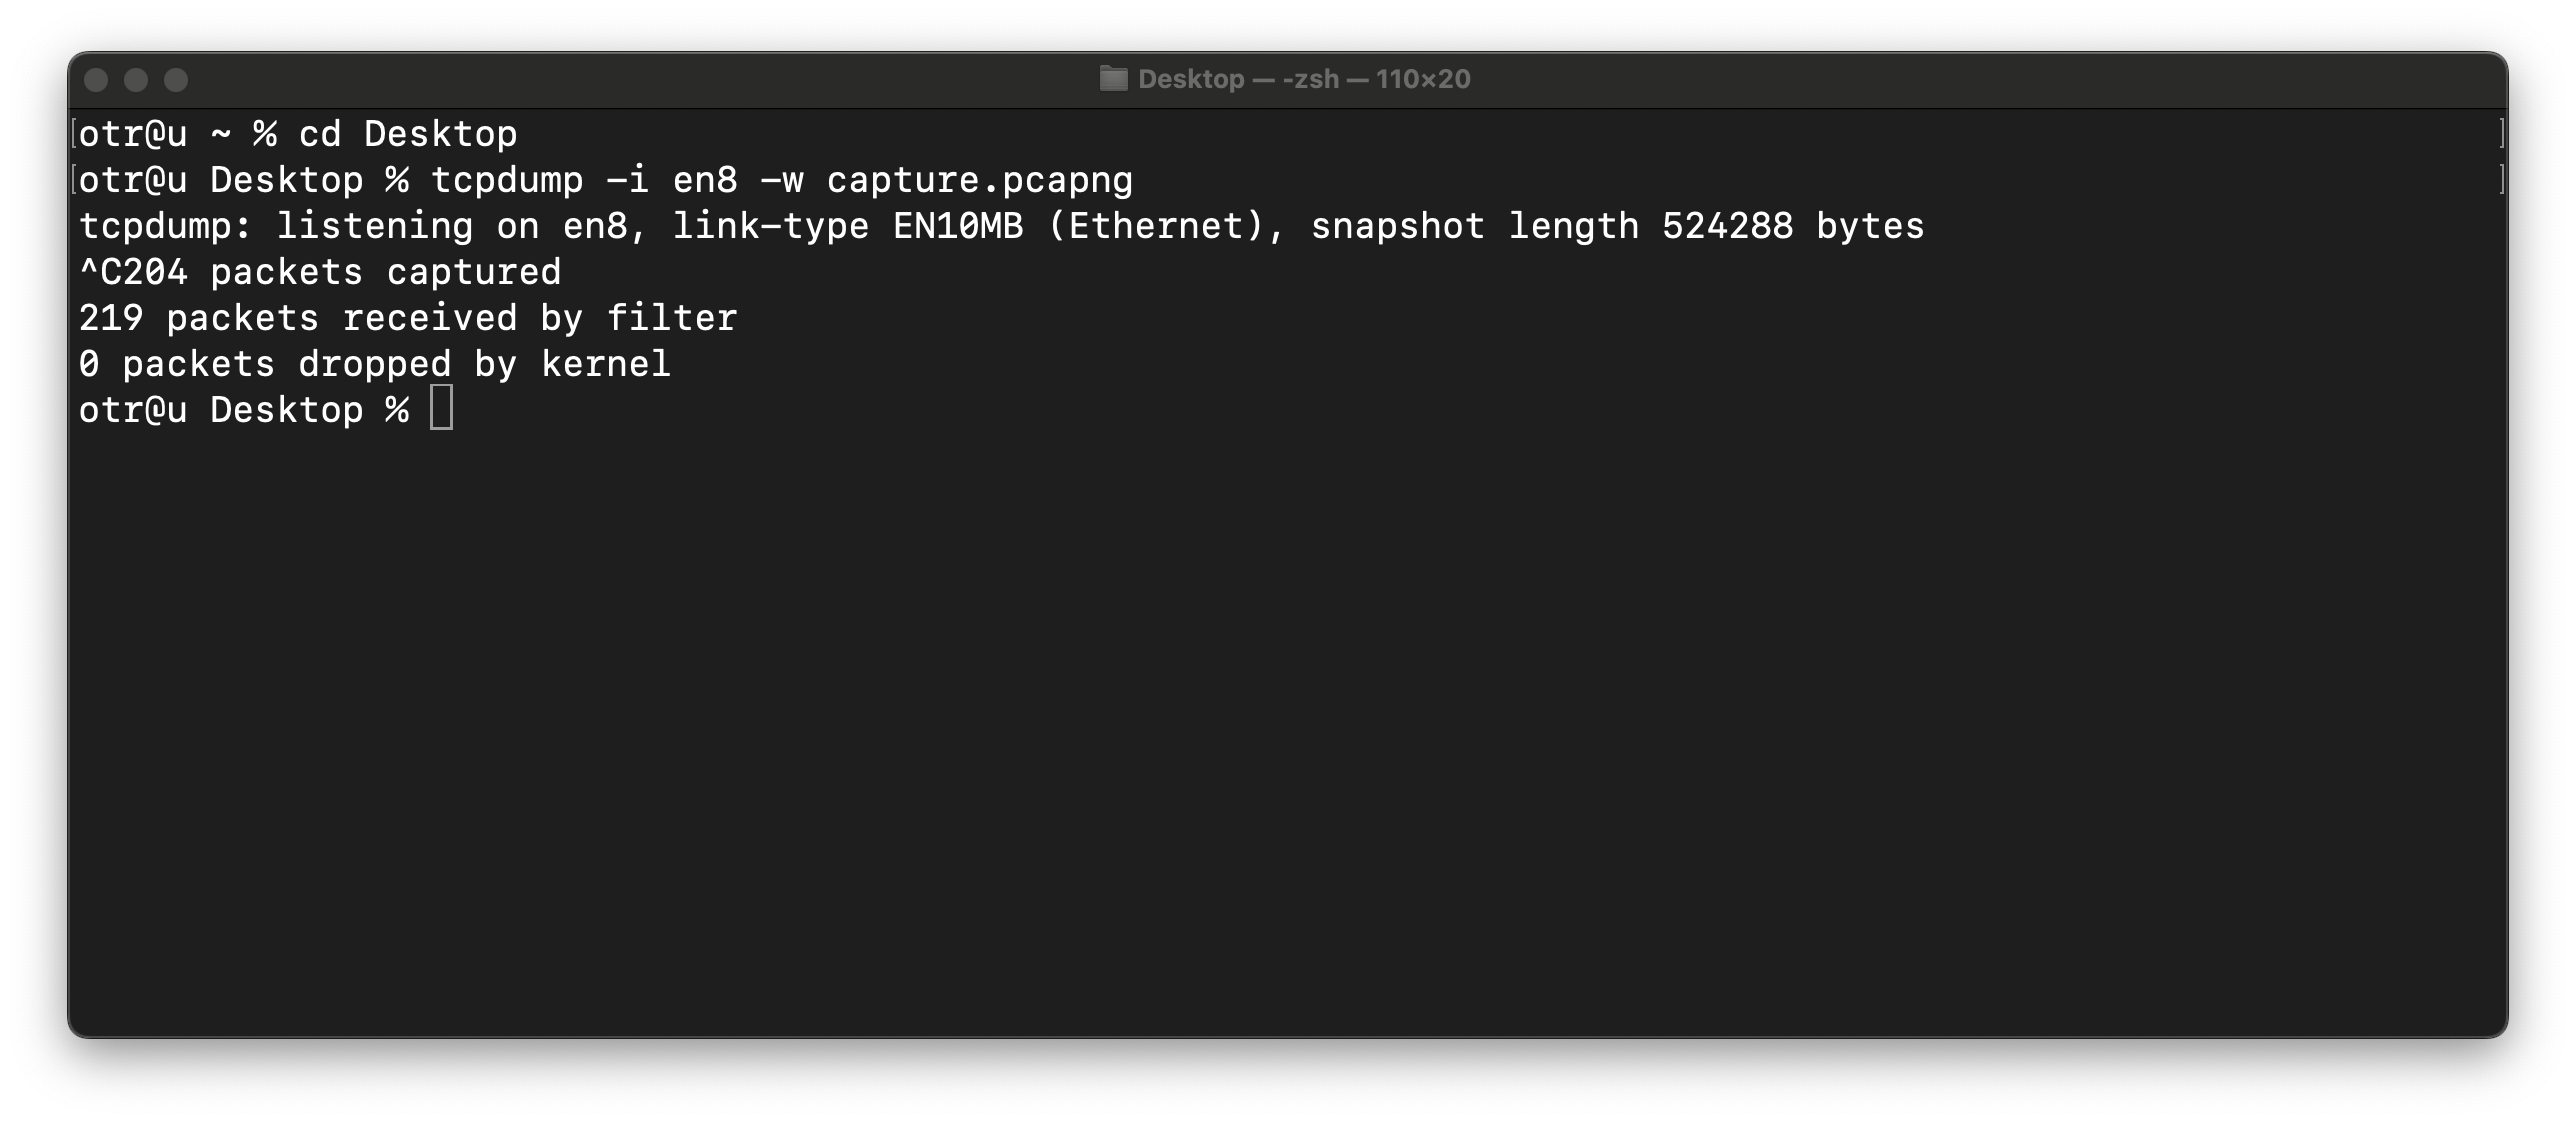
Optionally, you can capture with packet slicing activated. This does not capture all data but only the first 128 bytes, which is useful for privacy and when uploading to Packetsafari Analyzer for analysis. Note that slicing reduces visibility into the data, so only use it if you are sure all necessary information is captured.tcpdump -i en8 -w capture.pcapng -s 128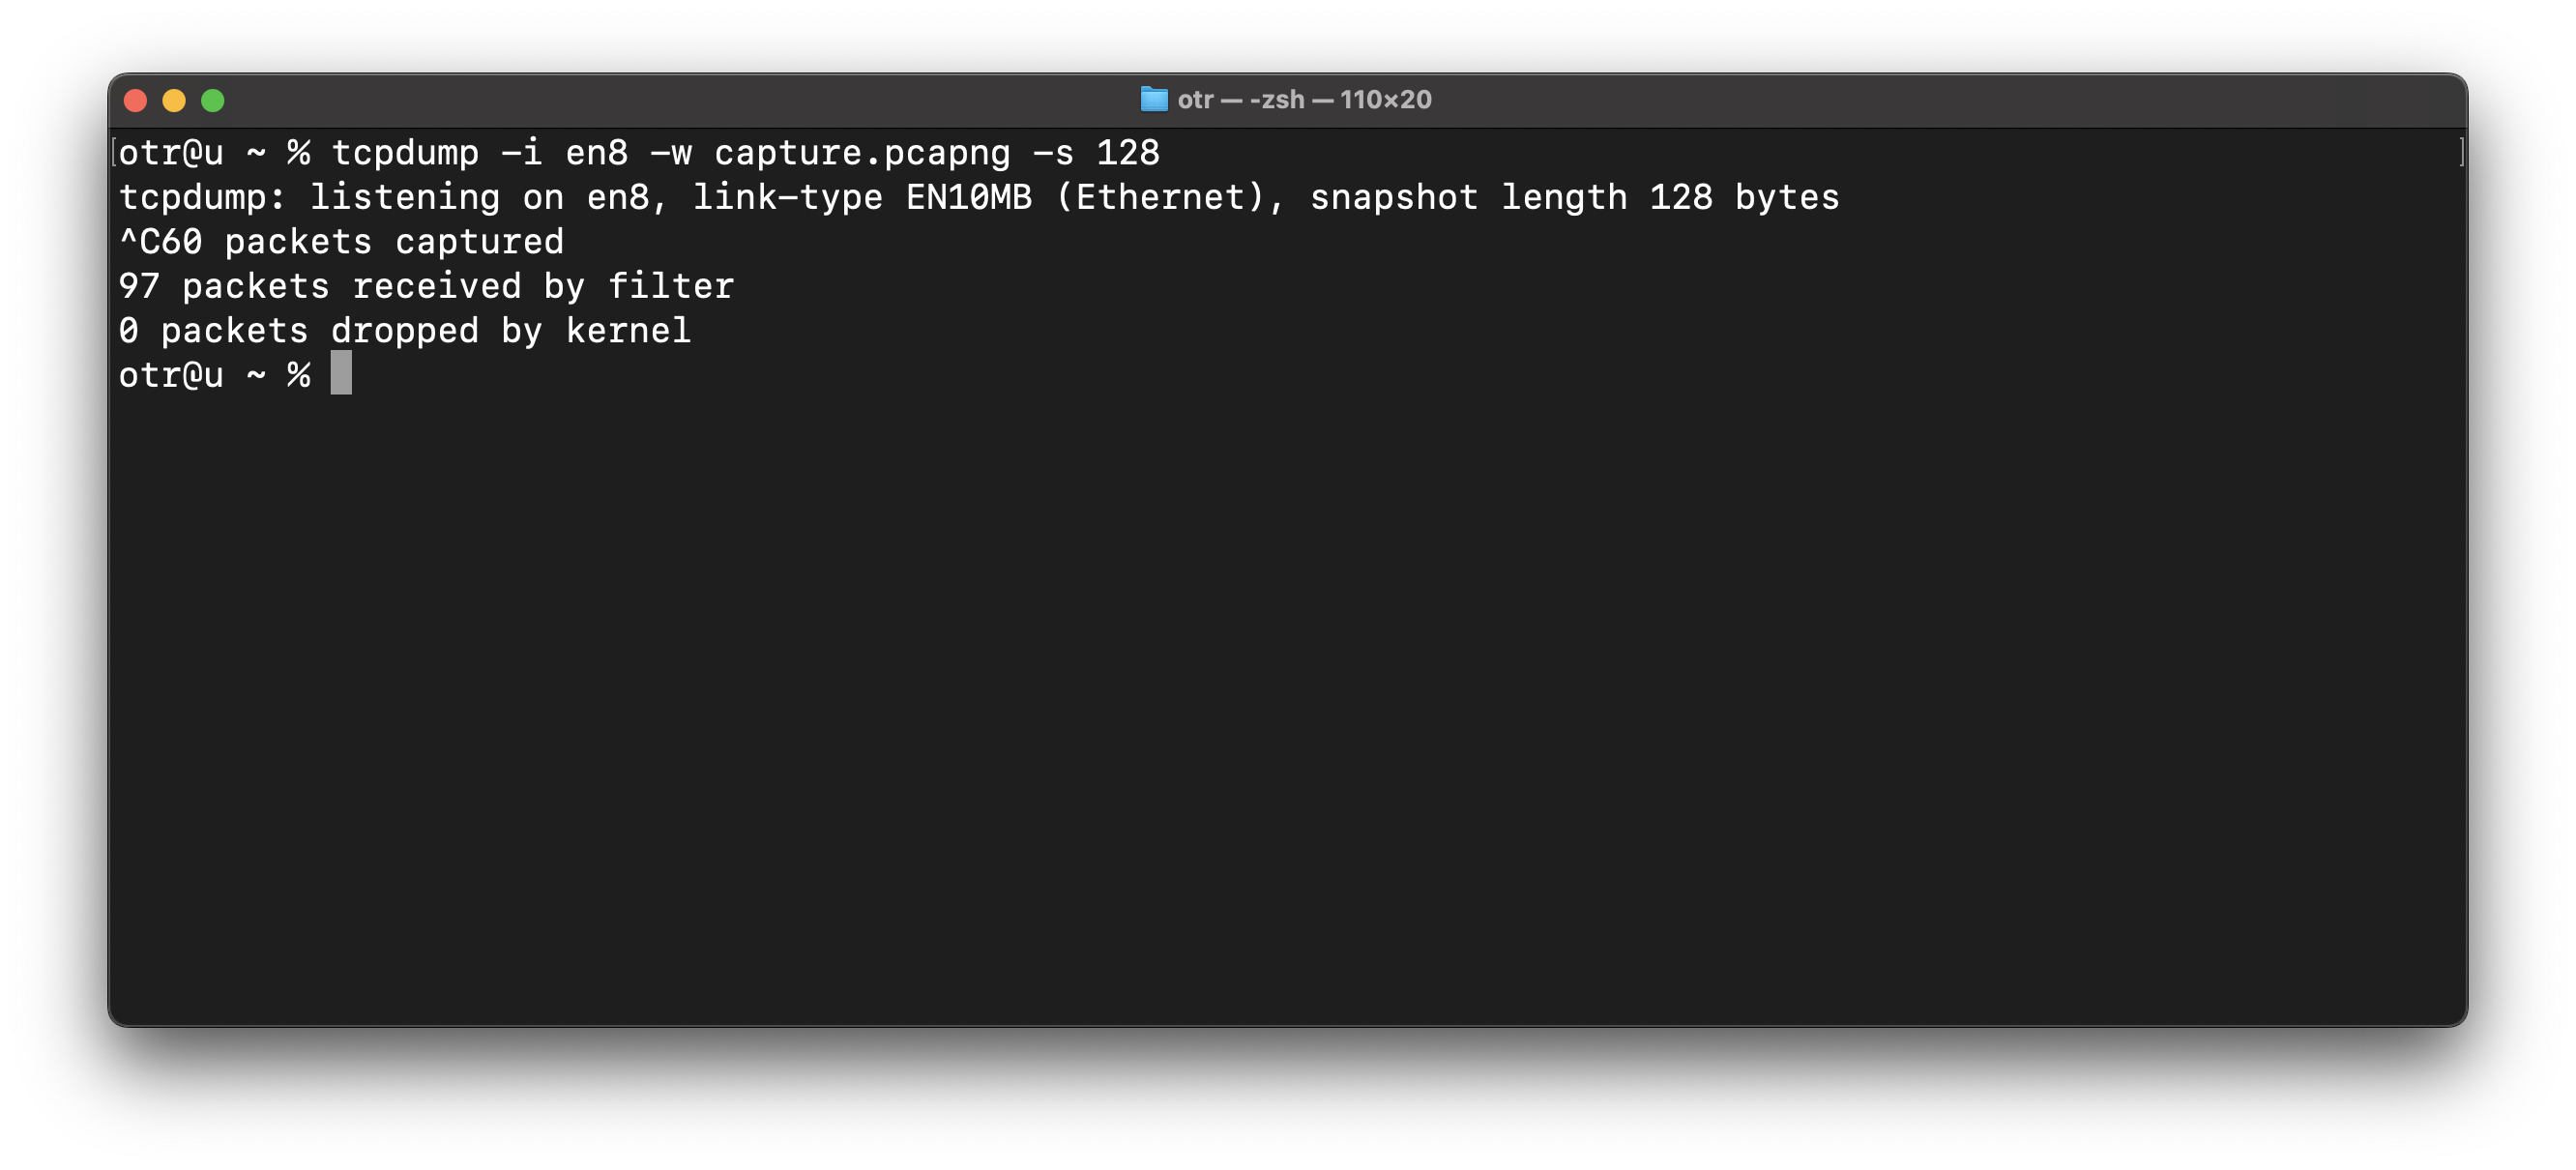
- Stop the Capture: Press Ctrl+C to stop the capture once you have gathered enough data.
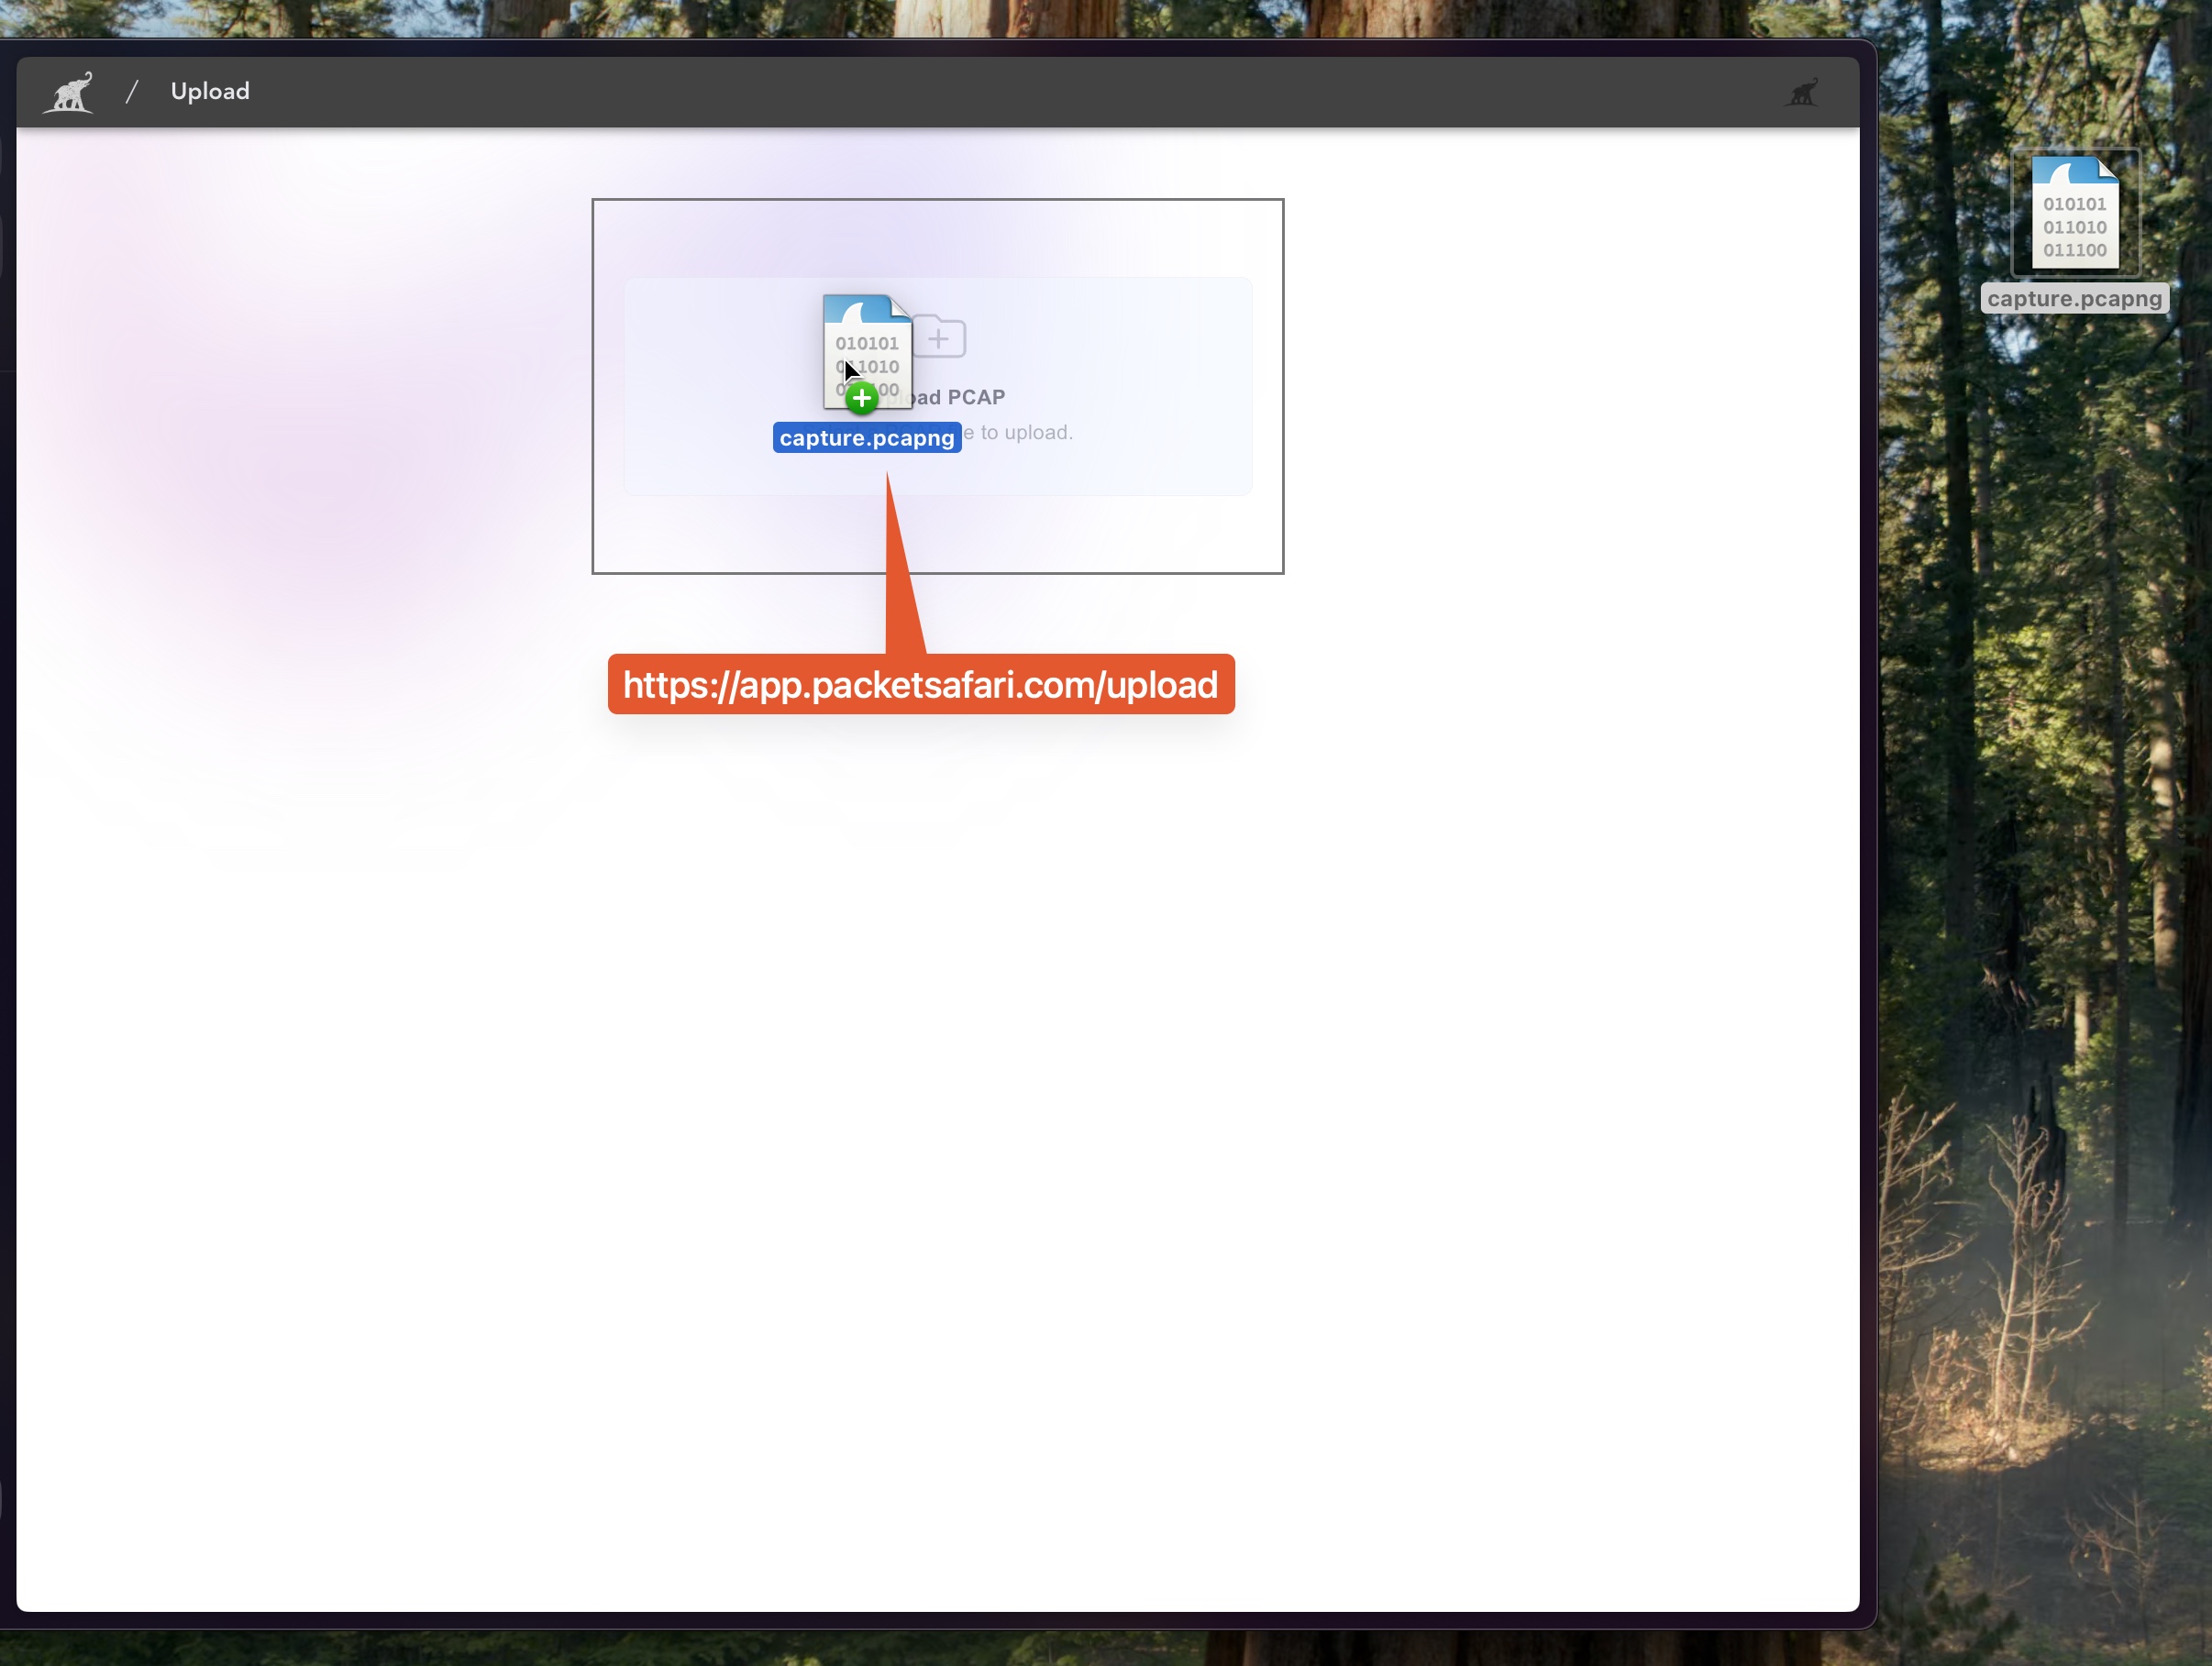
- Upload for Analysis:
Upload the trace via Packetsafari and analyze the PCAP. On Windows and Linux, upload your capture file to Packetsafari Analyzer and enjoy fast, accurate insights with the help of our Copilot AI.
Why Choose Packetsafari Analyzer and Copilot AI?
- No Installation Hassles
- Works with both PCAP and PCAPNG files (convert ETL files with ease).
- Our Copilot AI leverages advanced algorithms to provide clear insights, reducing troubleshooting time.
- The web-based interface makes it simple to upload, convert, and analyze packet captures with minimal setup.